How to build your data strategy
Harnessing data for better decision-making was once a luxury for big companies, but cloud computing has changed that. Now, businesses of any size can develop data-driven platforms to add value. Whether you have limited data capabilities or your current setup isn’t effective, leveraging data strategically is more accessible than ever.
This guide will provide you with recommended steps, examples, templates, and a workbook to establish a solid data strategy framework.
Let’s get started.

Table of Contents
Step 1: Getting the stakeholders involved
The first step in formulating a proper data strategy is identifying the key players. The key stakeholders ideally should have a vested interest in the data platform, a healthy dose of excitement, and a genuine passion for making more data-driven decisions across your organization.
Why engage stakeholders?
- Shared vision and buy-in: Ensuring that all stakeholders understand and share the vision of a data-driven organization is key. This collective understanding fosters a sense of ownership and commitment to the change.
- Diverse perspectives: Different stakeholders bring unique insights and perspectives that can help identify potential challenges and opportunities from various angles.
- Resource allocation: Stakeholder support is often crucial for securing the necessary resources – budget, personnel, or technology – to build and sustain data initiatives.
Who leads the data strategy engagements?
The best organizations create a cross-functional team typically led by someone in a Data/Analytics role or a leader within the IT organization. Sometimes, this team is led by a leader within a business unit or a central business team. This individual serves as the “point person” responsible for driving success.
Pro tip: It’s important to ensure the point person has a clear line of sight and understanding of your current data platform architecture. They should be comfortable making technology decisions for the organization and, ideally not develop the data strategy in a vacuum.
How to engage stakeholders?
-
- Identifying key stakeholders
Start by identifying who needs to be involved. This typically includes senior management, department heads, IT personnel, and key team members whom the shift toward data-driven practices will directly impact.
List the stakeholders in the “Stakeholders list” sheet from The Data Strategy Workbook. - Tailoring the message
Understand the motivations and concerns of each stakeholder. Customize your communication to address their interests and how a data-driven approach can benefit their domain. - Leave your ego at the door
We oftentimes want to get credit for our ideas, and we become very protective of them. From planning to implementation, we want to oversee the whole process. Try to regulate that feeling. Make it sound like everyone’s idea by asking questions and letting them brainstorm how they could better use data to improve performance. - Demonstrating value
- Use concrete examples and case studies to showcase the benefits of being data-driven. Highlight how similar organizations have achieved success by adopting data-centric practices.
- Present data-driven decision-making as a solution to existing problems within the organization. Show how data can clarify decision-making processes currently ambiguous or based on intuition.
- Creating pilot projects
- Implement small-scale pilot projects to demonstrate the practical benefits of data-driven decisions. Choose projects with visible and measurable outcomes to build confidence and showcase quick wins. Chapter 4 will cover how to develop value-packed short development sprints.
- Involve stakeholders in these pilot projects, giving them a firsthand experience of the process and benefits.
- Identifying key stakeholders
Pro tip: Marketing tends to be the perfect place to start. With standardized data sources and results significantly tied to data, it makes for an ideal starting point to demonstrate value.
Step 2: Discovery
This phase is all about understanding where you currently stand regarding data management and where you aspire to be. This process usually involves a combination of interviews, workshops, and technical assessments, engaging a wide range of stakeholders from different parts of the organization.
To streamline this critical phase, we’ve developed a series of steps and The Data Strategy Workbook, a practical tool to facilitate an in-depth discovery process. This workbook is crafted to guide stakeholders through a structured evaluation of their data systems, practices, and governance, ensuring a thorough analysis and identifying areas for improvement.
1. Current & desired state
Using The Data Strategy Workbook, fill in the “Current state” and “Desired state” columns from the “Data strategy planner” sheet. Be as detailed and precise as possible, and do not consider feasibility at this stage.
2. Business impact assessment
In The Data Strategy Workbook, access the Business impact assessment questions by clicking the “ + ” symbol at the top of column K. Answer the business impact questions. The more yeses you have, the higher the impact answering that question will have.
Pro tip: You may consider a question high impact even if it has few yeses. If that’s the case, set the business impact value to what you think is fair, communicate the reason to other stakeholders, and move on.
3. Data profiling
- Good: Historical and new data quality is good enough for analysis.
- Good moving forward: The data quality of the new data is good enough to be used for analysis. Historical data can’t or won’t be fixed. We will simply ignore historical data.
- Could be good: The data quality of the new data is good enough to be used for analysis. Historical data can and should be fixed.
- Bad: The data quality of historical and new data is NOT good enough for analysis.
Step 3: Data platform architecture
Whether you start from scratch or are considering migrating your current data platform to something more modern, there are so many options out there that it’s easy to get overwhelmed. In this section, we will cover what a data platform is, its goals, and the criteria to consider when deciding which one to implement.
What is a data platform?
As always, let’s start with a definition. A data platform is a comprehensive technology solution that enables organizations to collect, store, manage, process, and analyze large volumes of data from various sources. It is the foundational infrastructure for data management and analysis, supporting a wide range of applications and use cases, from business intelligence and analytics to data-driven decision-making and advanced data science projects.
Your data platform needs to be:
- Scalable
- Flexible & agile
- Performant & efficient
- Reliable
- Secure
- Cost-effective
- Easy to integrate with your existing IT ecosystem
- Allows easy data democratization
- Well documented
Alright, that’s the overview. In the next section, we will discuss the things to consider when choosing the technologies you’ll use as your data platform.
Data transformation before analysis is not just a procedural step but a strategic necessity. Through these processes, data transformation will empower your organization to unlock the true potential of its data assets.
Choosing your data platform technologies
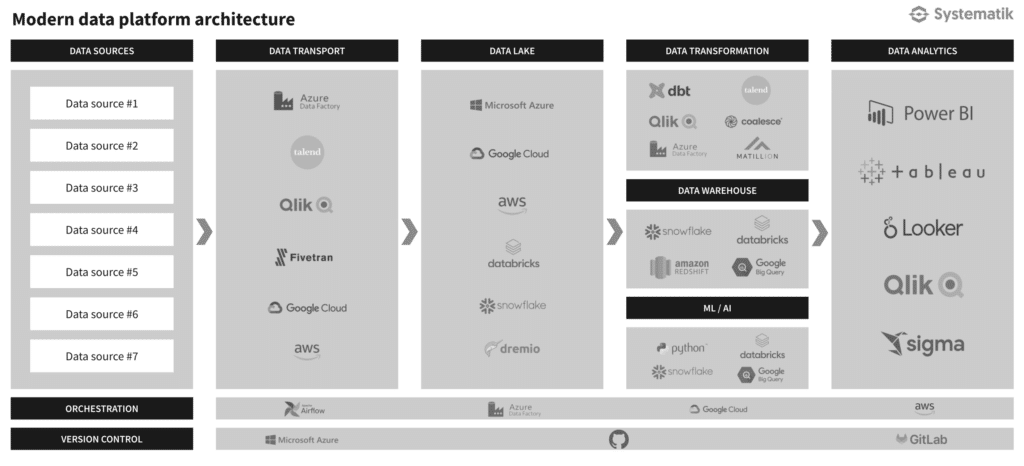
- Consider your organization’s IT ecosystem
- If you primarily use Google products such as Google Analytics 4, Google Sheets, etc. Then you should consider tools that integrate well with those tools
- Consider your entire data architecture and how each tool integrates with the other
- For example, Fivetran and dbt work well together. Looker and Google Cloud Platform is a great combo as well.
- Assess the skillset of your team and what is needed with those tools
- The features you’ll need are based on the data profiling exercise results. For a detailed list of requirements, fill in the “Data sources” and “DPT requirements” sheets from The Data Strategy Workbook (optional).
- Pricing For a more comprehensive assessment, complete the data platform technologies architecture checklist from the “checklist” sheet of The Data Strategy Workbook. Then use the “DPT comparison matrix” to easily compare the technologies you are considering.
The all-in-one solution trap
We consider a solution to be an all-in-one solution if it meets the following criteria:
- It has data visualization capabilities
- It offers many connectors to data sources across many industries (marketing, operations, finances, data warehouses, ERP, CRM, etc.)
- It offers a robust set of data transformation features
You might be tempted to use an all-in-one solution when choosing your BI tool. Don’t.
Here’s why:
Steep learning curve: While all-in-one solutions are designed to simplify data management by consolidating multiple functionalities, their wide range of features and complex interfaces can be overwhelming, requiring significant time and effort for users to become proficient. This steep learning curve can delay realizing the solution’s full benefits and hinder user adoption.
Partial connectors: All-in-one solutions often advertise a large number of connectors to various data sources and applications. However, these connectors may not fully support all the features and data types of the connected systems, leading to incomplete or inefficient data integration. Requiring additional customization or manual workarounds.
Missing Features: Businesses might find certain critical features missing or inadequately developed, necessitating additional tools or custom development to fill these gaps, which can complicate the data architecture.
Difficult to enforce basic data governance: All-in-one platforms may not provide the granular control and customization needed to enforce organization-specific data governance policies effectively. This can make it challenging to ensure data quality, consistency, compliance, and security, which are fundamental to reliable data management and analytics.
High costs: All-in-one solutions might seem cost-effective at first by consolidating tools, but their pricing, tied to usage, features, or user numbers, can surge as your needs expand. This increase in costs can undermine long-term viability, leading to a shift towards more customized, affordable options.
Specialized expertise required: Finding experts with the requisite knowledge of a particular all-in-one solution can be challenging due to the unique intricacies and proprietary nature of these platforms. This scarcity of specialized expertise can lead to higher costs for training or hiring and may limit an organization’s ability to quickly adapt and optimize the solution to meet evolving business needs.
Limited Data Ownership: Without a dedicated data warehouse, your data is stored externally, leaving you vulnerable if the vendor ends support or shuts down, potentially causing irretrievable data loss.
As a general rule, wherever possible, data transformation logic should not live in your BI tool.
Pro tip: As a general rule, wherever possible, data transformation logic should not live in your BI tool.
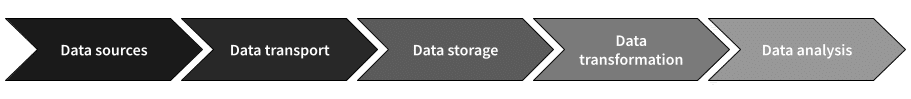
Drafting your data platform architecture diagram
You have now selected the technologies you’ll use for your data platform. To better visualize how data will flow and identify possible areas for improvement, we recommend drafting a simple diagram that represents your data platform. Here’s an example:
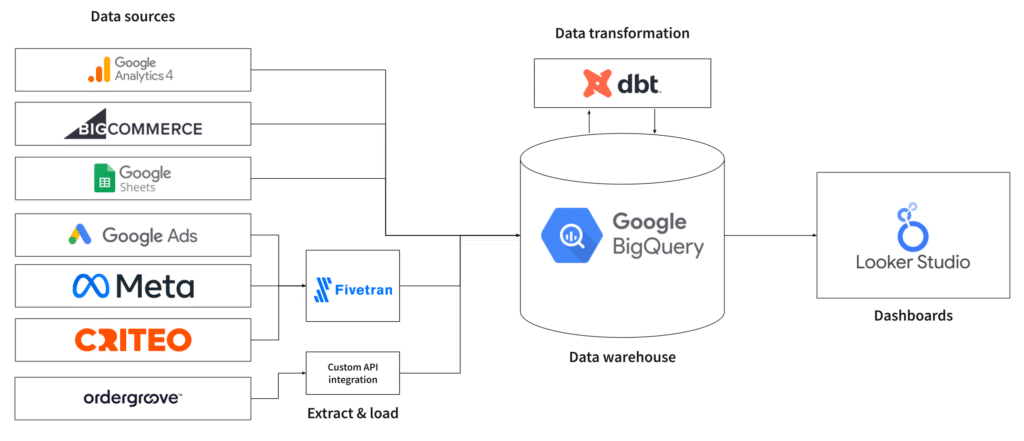
Why data needs to be transformed
The main reason for transforming data is a very simple one. Business questions typically require multiple data sources to be combined to be answered. By data sources, we mean either different tables from the same source (as in the example below) or completely different sources altogether (combining Meta Ads to Google Ads data, for example).
To learn more on this subject, I encourage you to read our article “Why data needs to be transformed“.
Step 4: Data governance
Definition & planning
Data governance is the framework of an organization’s policies, procedures, and standards to ensure that its data is accurate, accessible, secure, and used responsibly.
The Data Strategy Workbook has a checklist dedicated to data governance in the “checklist” sheet. This will help you understand what data governance is and what to implement. The level of detail for each item will vary depending on your data platform’s complexity and maturity.
Pay special attention to certain business units that have non-negotiable data governance requirements. Compliance reasons in certain industries require specific governance of the data platform.
Pro tip: Data governance should be an iterative process. As data platforms mature, the impact of not having specific components of a data governance program becomes increasingly important. On the other hand, over-engineering a data governance program can slow down progress and limit business value. The key is balance.
Maintenance
Why do data pipelines need to be maintained after the initial build-out?
Data pipelines collect data from various sources, combine them, apply several transformations, and form them into a single source of truth. A good robust pipeline will consistently deliver error-free data, but only as long as the sources it is designed for stay the same, which is rarely the case. Most pipelines are built assuming fixed schemas for the sources, which include column names, data types, or the number of columns. The slightest change in these data standards can break the pipeline, disrupting the entire process.
This makes data pipeline maintenance an iterative process that requires constant monitoring of several pipeline elements to ensure they are working as expected. Pipeline maintenance is a crucial part of the data ecosystem, as a broken pipeline leads to poor data quality, which impacts business reports and decision-making. But before moving forward, let’s talk about why maintenance is required.
Why does data change?
In an ever-evolving world, change is the natural order of things. Companies must constantly change their data models to evolve their business and accommodate customer needs. Data change within the organization usually occurs due to:
- Change in application structure: New input fields are added to the front end, creating new columns in the data tables. For example, Google Ads update its API.
- Manual alteration of tables: Some team members may create new columns and change data types or column names for personal requirements. They may even change the logic behind creating a table or a view, which may change its entire schema. For example, adding a new field in your CRM.
- Change in data standards: Certain changes in data standards, such as those by FHIR for medical records, may require adding or removing elements from a data model.
- Change in external data sources: Third-party data sourcing APIs may change their interface and format.
These changes break data pipelines by introducing elements not present at the building time. Many changes are unpredictable and only noticed while debugging a broken pipeline.
How are data pipelines maintained?
Modern data operations (DataOps) follow the same routines as regular DevOps, which include using modern tools and automated testing. These measures allow data teams to follow practices that help maintain the health and quality of data and pipelines. Some of these practices include:
- Using tools for change data capture: Change Data Capture (CDC) refers to using specialized tools to monitor data for significant changes. These tools help detect the change’s effect on existing pipelines and implement it wherever needed.
- Monitoring data sources: External APIs are monitored with strict validation tests to detect any change to the interface format. Early detection of these changes can save a lot of debugging time.
- Internal data tests: Data tests work similarly to unit tests in programming. They test script logic and data schemas to assert that all pipeline elements are as expected. These tests are implemented at multiple places so that no error goes undetected.
- Issuing alerts: Implement alerting mechanisms with all validation tests and monitoring methods to promptly notify data engineers of errors.
- Employing the correct team for maintenance: The best team available to fix data-related issues is the one that built the pipeline in the first place. These engineers have complete knowledge of the working of different elements and can apply fixes in the shortest time possible. This ensures minimum downtimes hence more efficient damage control.
These practices create a robust data infrastructure within the organizations, resulting in smoother workflows and accurate data.
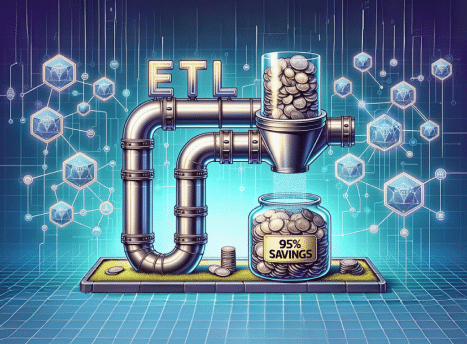
Pro tip: Robust documentation, quality checks, and alerts not only boost your data’s value but also cut maintenance costs significantly. Keep your data governance tight to keep your data clean and your costs down.
Step 5: Implementation & timeline
This step depends on how you plan projects at your organization, so we won’t spend too much time discussing this. Without going into the details of sprint planning, a good plan should have the following:
Effort required
You now know where you are and where you want to go, and you also know how you plan to get there. Before starting the implementation, it is important to re-prioritize the questions you want to answer based on the impact and effort required. We had to wait until we knew which architecture we would use before doing that.
This part of the process is technical and it is strongly recommended to have assistance from a data architect or senior data engineer. To help you complete this assessment, refer to The Data Strategy Workbook, and complete the data modeling effort section from the “Data strategy planner” sheet. Once done, your questions will fit somewhere in that quadrant:
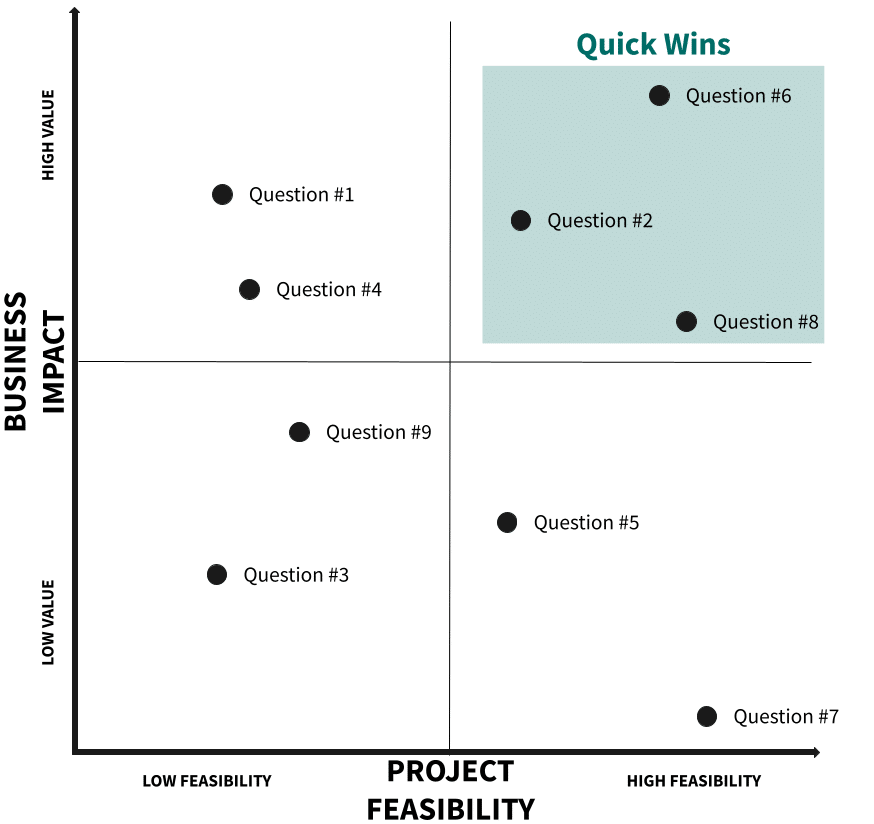
To gain momentum and quickly prove the value of your data initiative, we recommend starting with the questions that fall in the “Quick wins” category.
Sprint planning
Sprint Goal: A concise statement that ties together all the deliverables for the sprint, providing a clear objective and purpose for the team’s efforts.
Standalone Value: Each sprint should be designed to produce an increment of the product or service that provides value independently. This ensures that the work completed adds tangible value even if subsequent sprints are delayed or reprioritized.
Costs: An estimation of the sprint’s costs, considering personnel, resources, tools, and any other expenses. This helps align the sprint’s expected outcomes with the budget and assess the return on investment.
Timeline: A detailed schedule for the sprint, including start and end dates, key milestones, and deadlines for specific tasks. This helps track progress and ensures the team remains on course to achieve the sprint goal within the allocated time frame.
Capacity Planning: Estimating the available work hours for the sprint, considering team members’ availability, holidays, and other commitments. This helps in realistically assessing what can be accomplished.
Definition of Done (DoD): A clear and shared understanding among team members about what it means for a task or user story to be considered complete, ensuring quality and consistency.
Roles and Responsibilities: Clearly define each team member’s role and responsibilities to avoid confusion and overlap.
Communication Plan: How the team will communicate throughout the sprint, including daily stand-ups, sprint review meetings, and any other check-ins or updates.
Resource Allocation: Details about any resources (tools, software, external consultations, etc.) needed to achieve the sprint goals.
Stakeholder Engagement: A plan for how stakeholders will be involved or informed about the progress, including any scheduled demos or review meetings.
Contingency Plans: Strategies for dealing with potential issues during the sprint beyond the identified risks.
Pro tip: It’s crucial to resist overburdening a sprint with too many tasks or objectives. Balance your ambitions with the practical realities of your workflow, ensuring that each sprint is structured to deliver high-quality, well-documented outputs that stand the test of time. This might mean being more selective about what you commit to in each sprint, but it ensures you maintain the high standards your work requires and your stakeholders expect.
Conclusion
We hope this guide and our Data Strategy Workbook have been helpful resources on your organization’s data-driven journey. The core concepts and recommended practices outlined are relevant for any organization, regardless of their size, industry, or current level of data and analytics maturity.
At Systematik, we understand the critical role this work plays in achieving your goals. We stand ready to support you, leveraging years of experience and expertise gained from working with clients at all stages of development. We offer a comprehensive toolkit including tools, processes, reference architectures, and a team dedicated to empowering you to unlock the full potential of data and analytics within your organization.
Our latest blog posts

Why your business needs a measurement strategy
Discover why your business needs a measurement strategy. Learn how a well-defined data strategy can enhance decision-making, optimize operations, and drive growth.

How to build your data strategy
This guide will provide you with recommended steps, examples, templates, and a workbook to establish a solid data strategy framework.

Why data needs to be transformed
Why can’t we simply connect raw data to dashboards and start analyzing? In this article, we will go over 7 reasons why data needs to be transformed before analysis.