Partnering with Good Ranchers as their external data team
Good Ranchers is a mission-driven e-commerce brand that provides high-quality, sustainably sourced meat from local U.S. farms.


“Partnering with Systematik has been a game-changer for us. They stepped in as our external data team, bringing a level of expertise and responsiveness that has far exceeded our expectations. Their deep understanding of the latest data analytics trends and their ability to seamlessly integrate with our operations have not only kept us ahead of the curve but have also cemented them as real partners in our growth journey. Their dedication to our success is evident, and we’re grateful for this partnership and the competitive edge it has and continue to provide.”
Alex Valdez
Tech Lead at Good Ranchers
The problems
Due to their rapid growth and the growing complexity of their tech stack, it became extremely difficult to have a good overview of the business’s performance. They needed an easy way to answer questions such as:
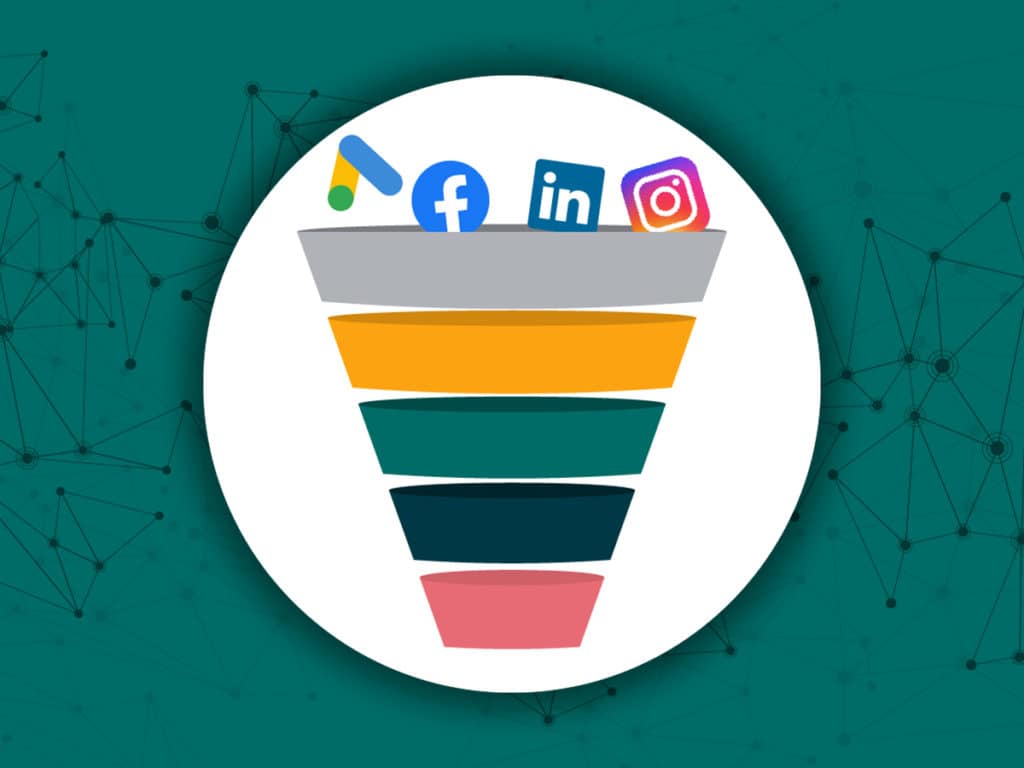
- Which marketing channel is generating the most sales?
- What is our conversion rate when we release a new promotion?
- How much can we afford to pay to retain a customer?
- What is the revenue split between one-time and subscriptions?
- What is our return on ad spend?
- What is our gross margin per product?
- Based on forecasted sales, how many of each product should we add to our inventory?
- What are the main reasons customers churn?
With no data architecture in place and the need to migrate to Google Analytics 4, we had to build everything from scratch.
The solutions
E-commerce tracking for headless website
E-commerce tracking for a headless website built on top of BigCommerce is always more complicated than regular e-commerce tracking. Add to that the need to migrate to Google Analytics 4 when it just came out, and it was clear we would have to build a custom solution.
The solution we built combines custom code and regular tracking using Google Tag Manager. If you’re interested in reading about the technical aspect of this setup, read our article “E-commerce tracking for a headless website”.
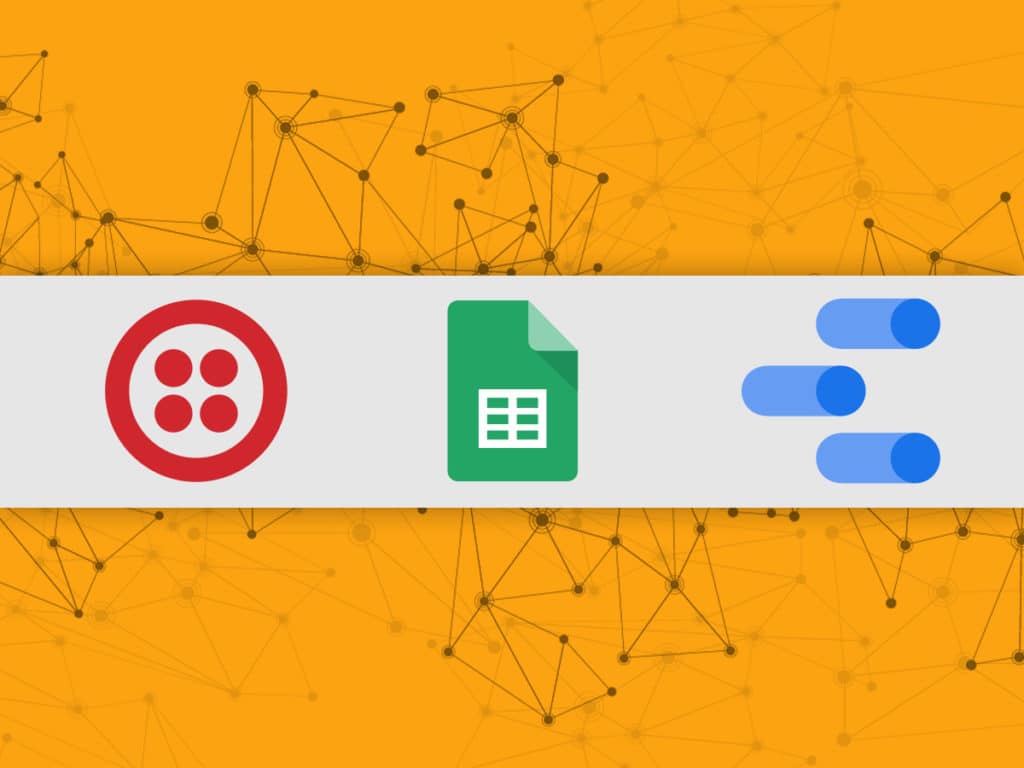
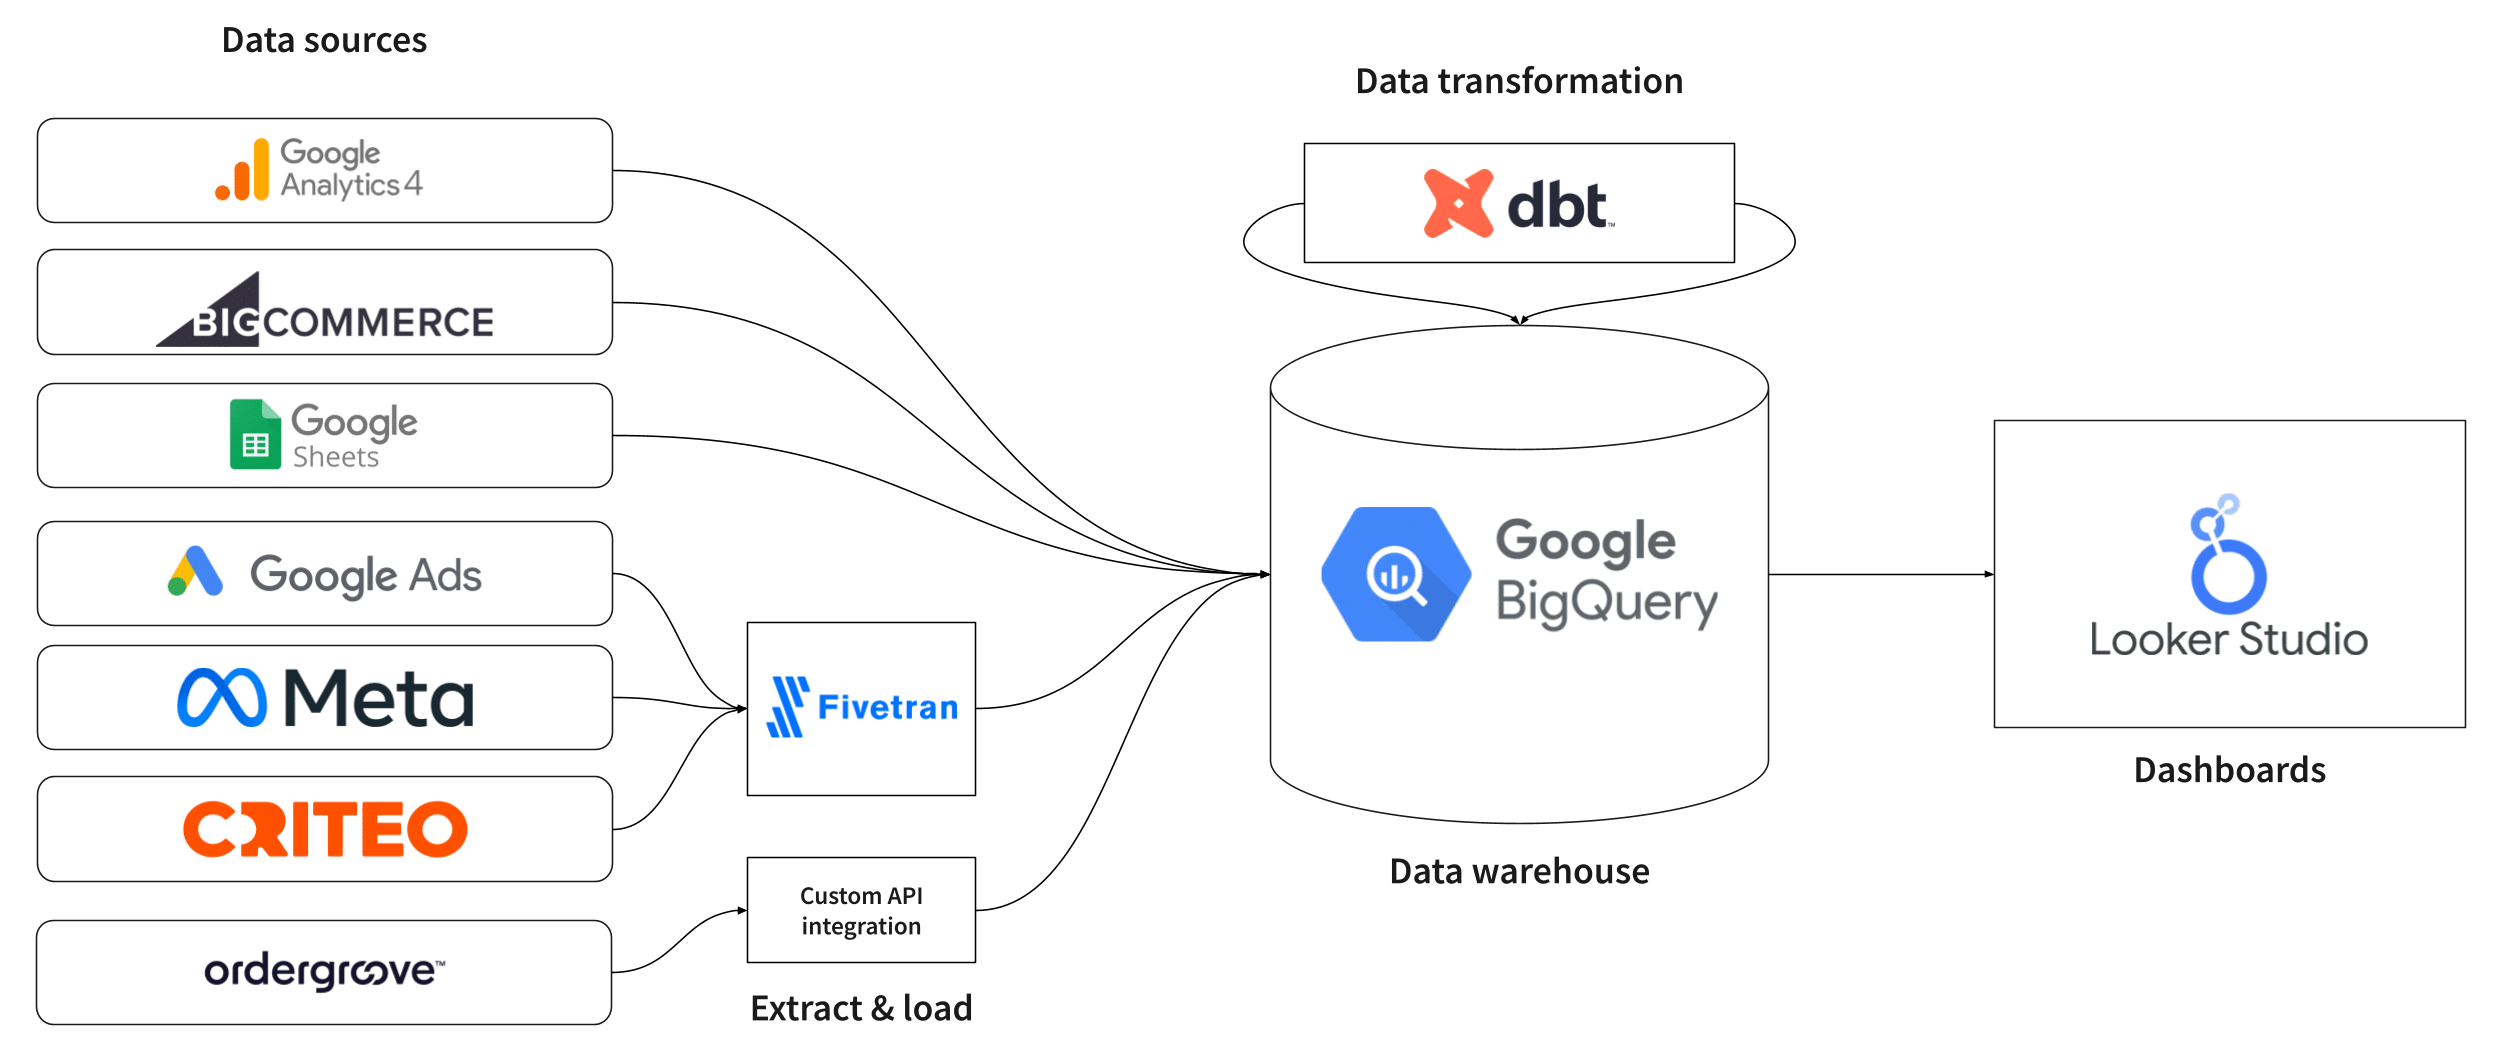
Loading data to BigQuery
With 8 different data sources and 100+ tables, we loaded their data to BigQuery using various methods. Google Analytics 4, Google Sheets, and BigCommerce were loaded using their built-in connection to BigQuery. We used this to load Meta Ads, Google Ads, and Criteo Ads data. Finally, we built a custom API integration to load Ordergroove data into BigQuery and even helped the people at Ordergroove improve their API to accommodate Good Ranchers’ needs.
Data transformations
As you can guess from the questions they want their data to be able to answer, heavy transformations were required. As we are a trusted dbt (data build tool) partner, this was obviously our tool of choice for data modeling.
- The main transformations were:
- Enrich BigCommerce data with SKU costs, shipping costs, subscription information, and fulfillment center.
- Multi-touch attribution down to the ad group level. To do so, we built our own Markov Chain data-driven attribution model and combined it with our Modern UTM Strategy.
- Bring every metric & dimension at the order line item level.
In this step, we also built all the necessary failsafe mechanisms, alerts, and data tests to ensure the data pipeline is robust and maintains the highest data quality possible.
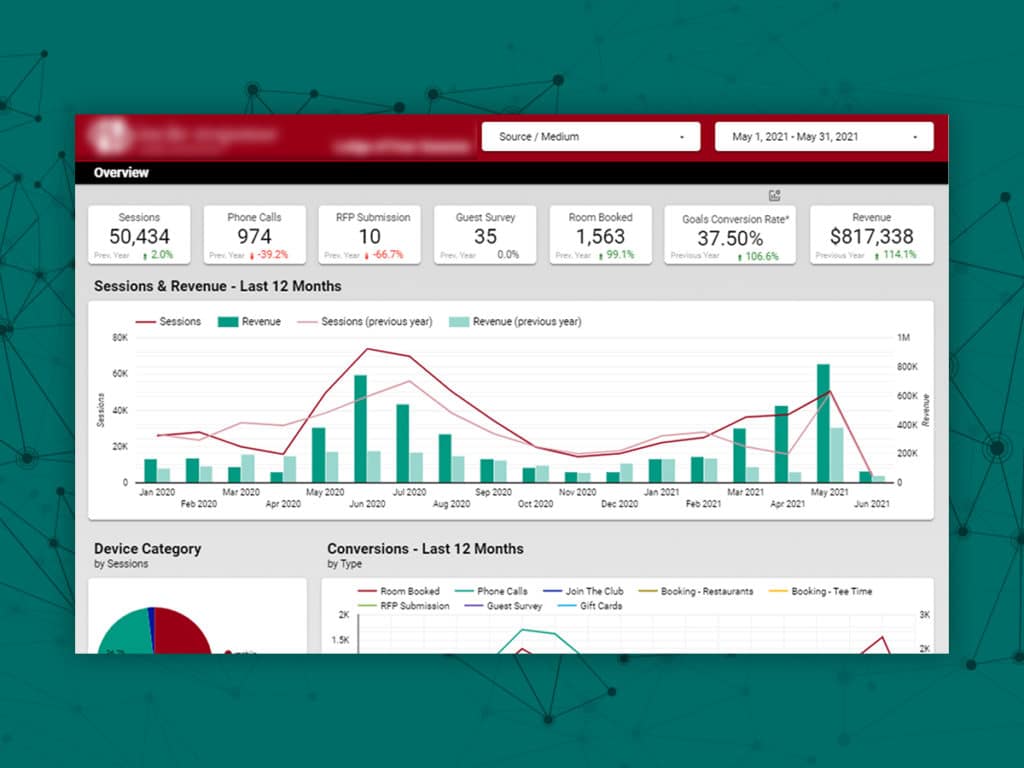
Data visualization
Now that the data is finally refined into something that can quickly answer their questions, it is time to connect it to a dashboard for self-service. Each dashboard also displays comparison metrics based on the client’s requirement (month over month, year over year, against the previous period, against target). Here’s the dashboard categories list and the main KPIs we built for them.
- Finances (by date, product, revenue type, state, city)
- Discount amount
- Refund amount
- COGS
- Gross profit
- Gross margin
- Orders (by order creation date, order shipped date, product, revenue type, state, city, discount code, marketing channel, fulfillment center)
- Number of orders/items
- Revenue
- Refund amount
- Average order value (AOV)
- Refunds (by refund date, refund reasons, product, revenue type, state, city, discount code, marketing channel, fulfillment center)
- Refund quantity
- Refund amount
- Refund rate
- Subscriptions (by subscription creation date, next order date, product, revenue type, state, city, discount code, marketing channel, fulfillment center)
- New subscriptions
- Active subscriptions
- Cancelled subscriptions
- Growth rate
- Churn rate
- Revenue churn rate
- Planned recurring orders (forecast of orders based on subscription renewal dates)
- Customers (by date, customer creation date, customer segment, cohort, state, city, acquisition channel, subscription type)
- New/returning customers
- Lifetime value (CLV)
- Average order value (AOV)
- Average number of orders over lifetime
- Repurchase rate
- Paid Ads (by date, ad platform, campaign, ad group)
- Impressions, clicks, click-through rate, conversions, conversion rate
- Spend, CPM, CPC, Cost per Conversion
- Return on Ad Spend (ROAS)
- Web Analytics (by date, source/medium/campaign/ad group, state, device, landing page, discount code)
- Sessions, Users, New Users, Page Views, Purchases
- E-commerce funnel (view product, add-to-carts, begin checkout, web purchases)
- Conversion rates
- Average web purchase value
- Pipeline Monitoring
- GCP costs
- Execution time
- Compiled code
- Scheduled run status
Smart Alerts
Using historical data and the targets for each KPI, we built smart alerts that inform us and the clients when:
- A KPI behaves abnormally (drop in purchases or conversion rate for example)
- A KPI is trending away from it’s target
Ongoing support and business intelligence
The executives at Good Ranchers understand that a data pipeline isn’t a set-and-forget project. Technology and their needs are constantly changing. Their data architecture needs to adapt to those changes. By partnering with us on our monthly package, they have peace of mind that their pipeline will continue working, ask us for any ad-hoc requests, and even deep analysis to uncover growth opportunities. We are still working with them to this day.
Here are some of the analyses we performed for them:
- Cohort analysis
- Buyer segmentation (aka RFM analysis)
- Sales + margin forecasting
- Churn analysis
- E-commerce funnel analysis
Our latest case studies
Partnering with Good Ranchers as their external data team
To get to the next level, the people at Good Ranchers understood they needed to start leveraging data.

Staff augmentation for fast analytics
How WholesomeCo Director of Analytics partnered with Systematik to augment their staff and migrate to dbt.
Streaming network data pipeline
Creating a single source of truth in less than 3 weeks for Axon Studios.