Leveraging Twilio API for reporting
How we helped Gain Leads, a digital marketing agency, offer call reports to their clients with this simple API integration.

“Systematik is the real deal when it comes to data analysis and reporting. They built custom dashboards with scheduled weekly reports that are automatically shared with my clients. My team and I can now spend less time on reports for clients and more time improving our campaigns. I highly recommend them.”
David Edwards
Founder of gain leads
The problems
- Their clients needed an easy way to see if their marketing effort was paying off.
- Their clients wanted to know how many calls over 30 seconds they received, with day and time as well.
- Their clients are not tech-savvy so the solution needed to be super simple.
The solution
- We identified the KPIs that are important for their clients
- We automated connected Looker Studio to Google Ads
- We built an app script that connects to Twilio’s API and extracted daily call data to report in Looker Studio.
- We created a template that would be easy to duplicate for each client.
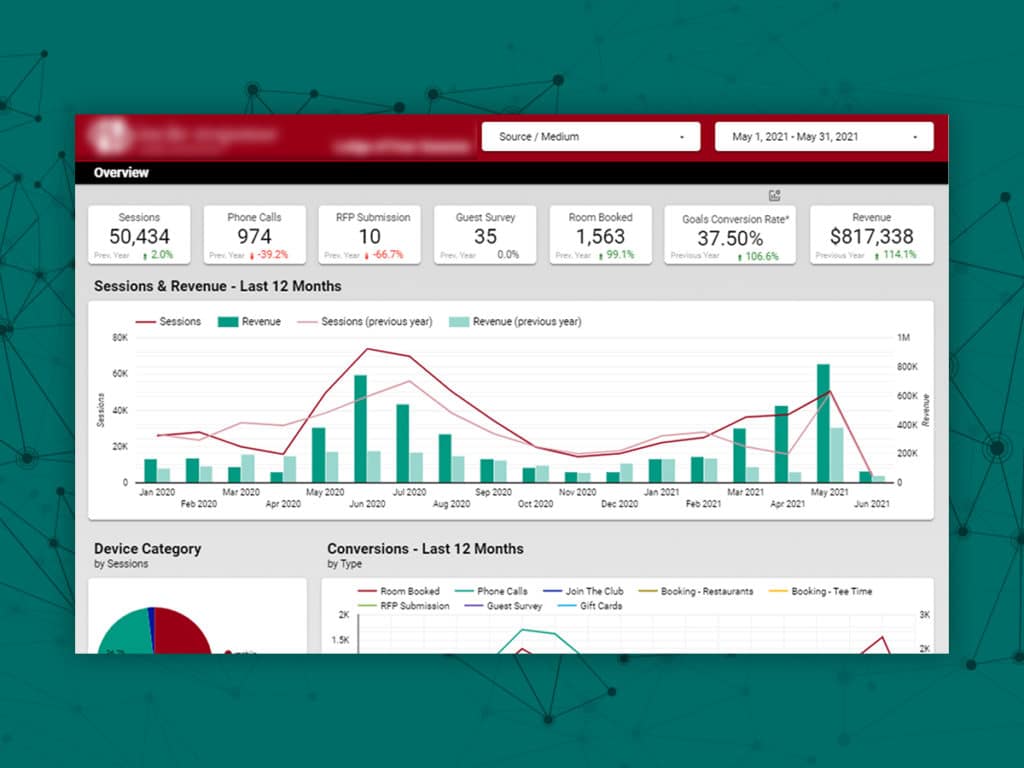
- Bring it all together in Looker Studio with a branded dashboard that they could easily share with their client or even schedule monthly reports to be sent automatically.
The results
A simple, yet effective automated report that their clients can access anytime from their browser. We also added a scheduled pdf report to be sent monthly for clients who won’t take the time to go online and use the report.
The technical stuff
Google Ads dashboard features
- Filters (date range, google ads campaign, client)
- Number of clicks
- Click-through rate
- Impressions
- Conversions
- Conversion rate
- Cost per conversion
- Total spent
- Average cost per click
- Top campaigns table
- Line chart with conversion and clicks over time
Twilio dashboard features
- Filters (date range, client)
- Number of calls received
- Number of first-time callers
- The number of calls with a duration equals or greater than 30 seconds
- Number of calls with a duration of less than 30 seconds
- Average call duration
Number of calls over time by type & time of day - Number of calls over time by type & day of week
Technology used to build the dashboards
- Google Looker Studio (data visualization)
- Google sheets
- Google app Ssripts
- Twilio’s API
Our latest case studies

Partnering with Good Ranchers as their external data team
To get to the next level, the people at Good Ranchers understood they needed to start leveraging data.

Staff augmentation for fast analytics
How WholesomeCo Director of Analytics partnered with Systematik to augment their staff and migrate to dbt.
Streaming network data pipeline
Creating a single source of truth in less than 3 weeks for Axon Studios.


