Increasing conversion rates using data
How we helped Spaceful Technologies increase their conversion rate by 87% by identifying where leads were being lost and monitoring their sales team performance.


“We’ve been working with Systematik for the past 2 years now. They have been in charge of our data analysis, architecture strategy, and implementation. The insight we got from their automated dashboards allowed us to make major adjustments to our sales strategy. As a result, we have seen a dramatic increase in conversion rates. I can’t recommend them enough. “
Maxime Villemure
Co-founder of Spaceful
The problems
- With their team getting bigger (30+ full-time employees), they needed a way to track their results and keep everyone accountable.
- Massive technology stack (using more than 20 different software daily).
- With their data divided between multiple platforms, it was getting very difficult to make business decisions without a comprehensible overview of their operations. They needed to find a way to quickly see how the company is performing per department for any given date range.
The solution
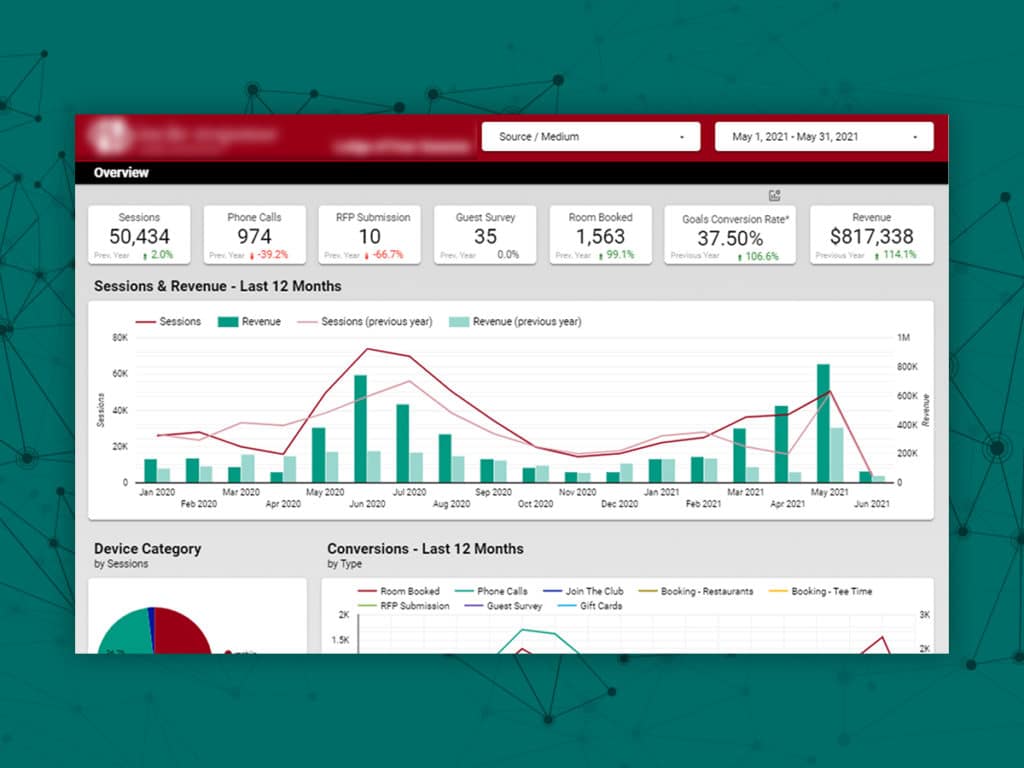
After a strategy meeting with them, it was clear that we needed to offer them a way to quickly see how their company is performing. Most specifically their sales department. So we went to work and came back with a proposal for an automated dashboard that would consolidate all their data sources and display the information they cared about in a comprehensible way. The project followed the following steps.
- We identified the KPIs for their marketing, sales, and customer support departments
- We automated and centralized the collection of the data needed
- We built the automated dashboards in Google Looker Studio
The results
The results were, to take the CEO’s words, eye-opening. They clearly needed to rethink the way they approached sales. With that information updating in real-time, they were now able to confidently make important business decisions like doubling their sales team headcount to reduce the time before they establish the first contact with a new lead. This led to the following results.
- Conversion rate increased by 87%
- More than 5 hours a week saved in data analysis and performance review
- The ability to predict future revenue
- The ability to assess performance by employee’s instead of by departments
The technical stuff
Sales dashboard features
- Filters (date range, sales rep, service offered)
- Number of leads
- Number of qualified leads
- Number of leads that needs to be contacted ASAP
- Won deals
- Conversion rate
- Completed service
- Cancellation
- Cancellation rate
- Deal attribution by sales rep
- Deal creation attribution by type of service per day
- Sales team performance overview per sales rep
- Lost deal distribution by reasons
- Won deals distribution by language
- Deals created distribution by language
- Update in real-time
Call center dashboard features
- Filters (date range, agent)
- Number of calls made
- Number of inbound calls
- Number of outbound calls
- Overall time spent on calls
- Average time per call
- Average time between lead creation and the first contact
- Call distribution by department
- Call distribution direction (inbound, outbound) by days of the week
- Call distribution by departments over time
- Missed call distribution by department
- Missed call distribution by reasons
- Overall performance review by agents
- Update in real-time
Technology used to build the dashboards
- Google Looker Studio (Data visualization)
- Google Sheets
- Integromat (automation)
- Google Scripts
- Pipedrive Workflow (automation)
- Pipedrive’s API
- Aircall’s API
Spaceful’s main technology stack
- Pipedrive (CRM)
- Autopilot (email marketing)
- Aircall (VoIP)
- Custom-built platform (operations & website)
- WordPress (landing page)
- CallRail (call tracking)
Our latest case studies

Partnering with Good Ranchers as their external data team
To get to the next level, the people at Good Ranchers understood they needed to start leveraging data.

Staff augmentation for fast analytics
How WholesomeCo Director of Analytics partnered with Systematik to augment their staff and migrate to dbt.

Streaming network data pipeline
Creating a single source of truth in less than 3 weeks for Axon Studios.


