Why data needs to be transformed

Why can’t we simply connect raw data to dashboards and start analyzing? After all, it’s much easier, and you can’t have more accurate data than the source data, right?

To answer this question, we need to understand how raw data is structured and how business questions are typically structured. Let’s dive in and see why transforming data is more than an unnecessary hurdle – it’s your key to smarter, more insightful business decisions.

Reason #1 – Combining multiple data sources

The main reason for transforming data is a very simple one. Business questions typically require multiple data sources to be combined to be answered. By data sources, we mean either different tables from the same source (as in the example below) or completely different sources altogether (combining Meta Ads to Google Ads data, for example). Let’s consider the following example to understand this better.

Imagine that you are operating an e-commerce business using Shopify.

A typical business question would be something like this:

What was our revenue by product, by state, in November 2023?

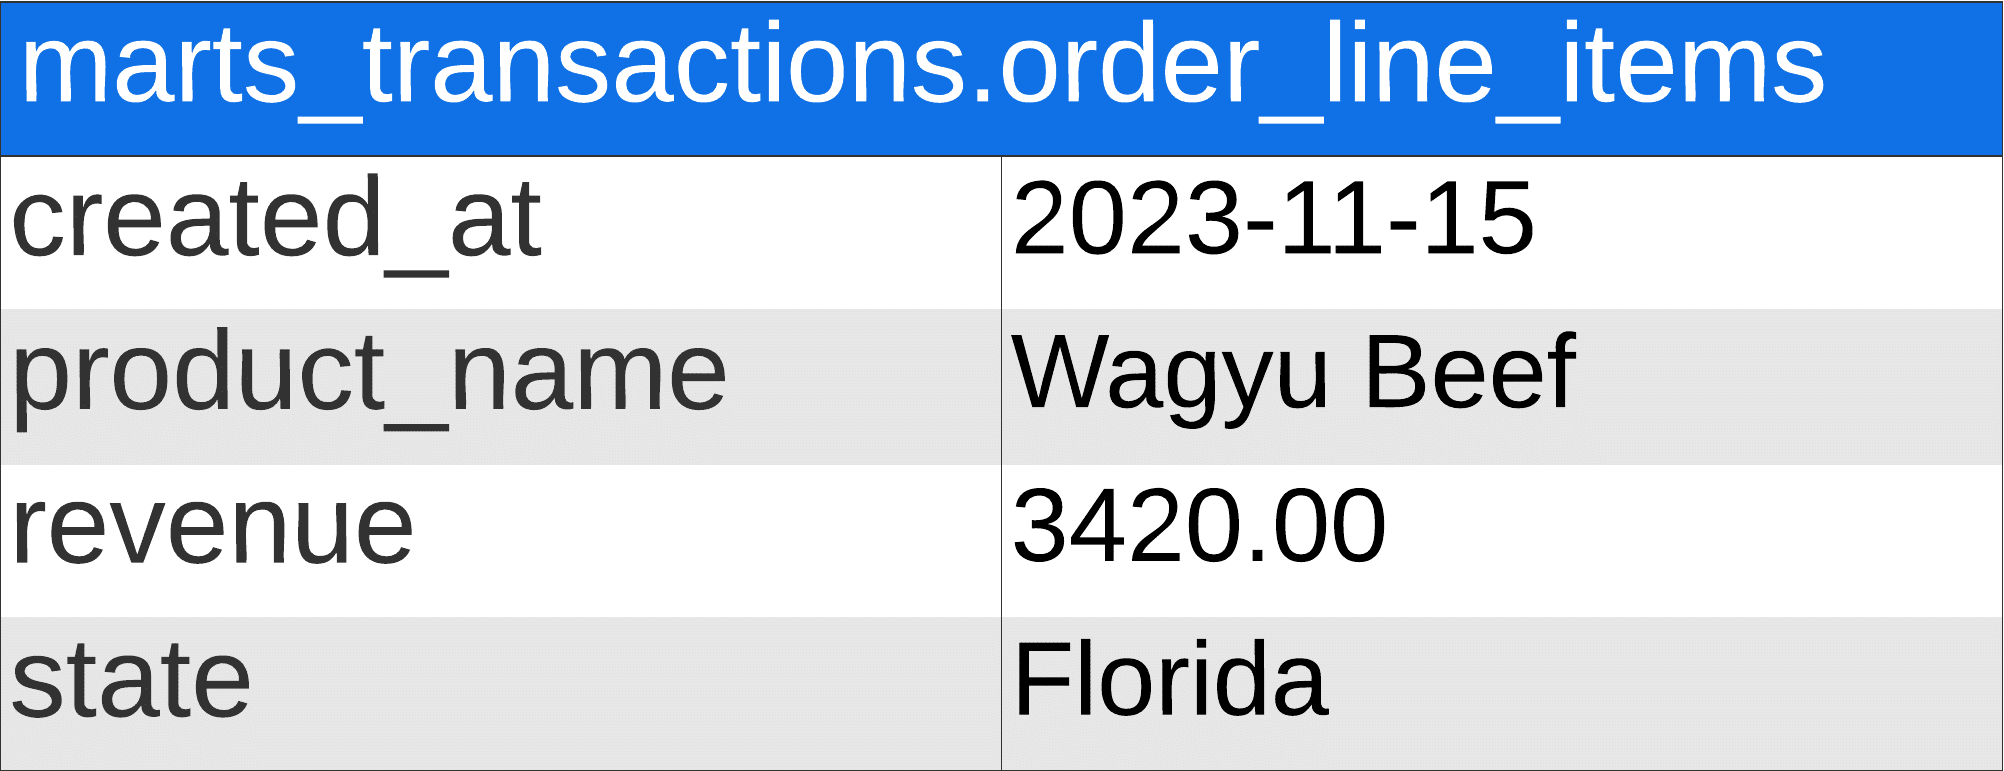
In a perfect business intelligence world, our Shopify data would be structured like this:

Ideal table

Figure A, The table shown is transposed for easier visualization.

Data would be aggregated, we would have date, revenue, and state columns, and life would be good.

Unfortunately, data from software is organized very differently than what we need for business intelligence.

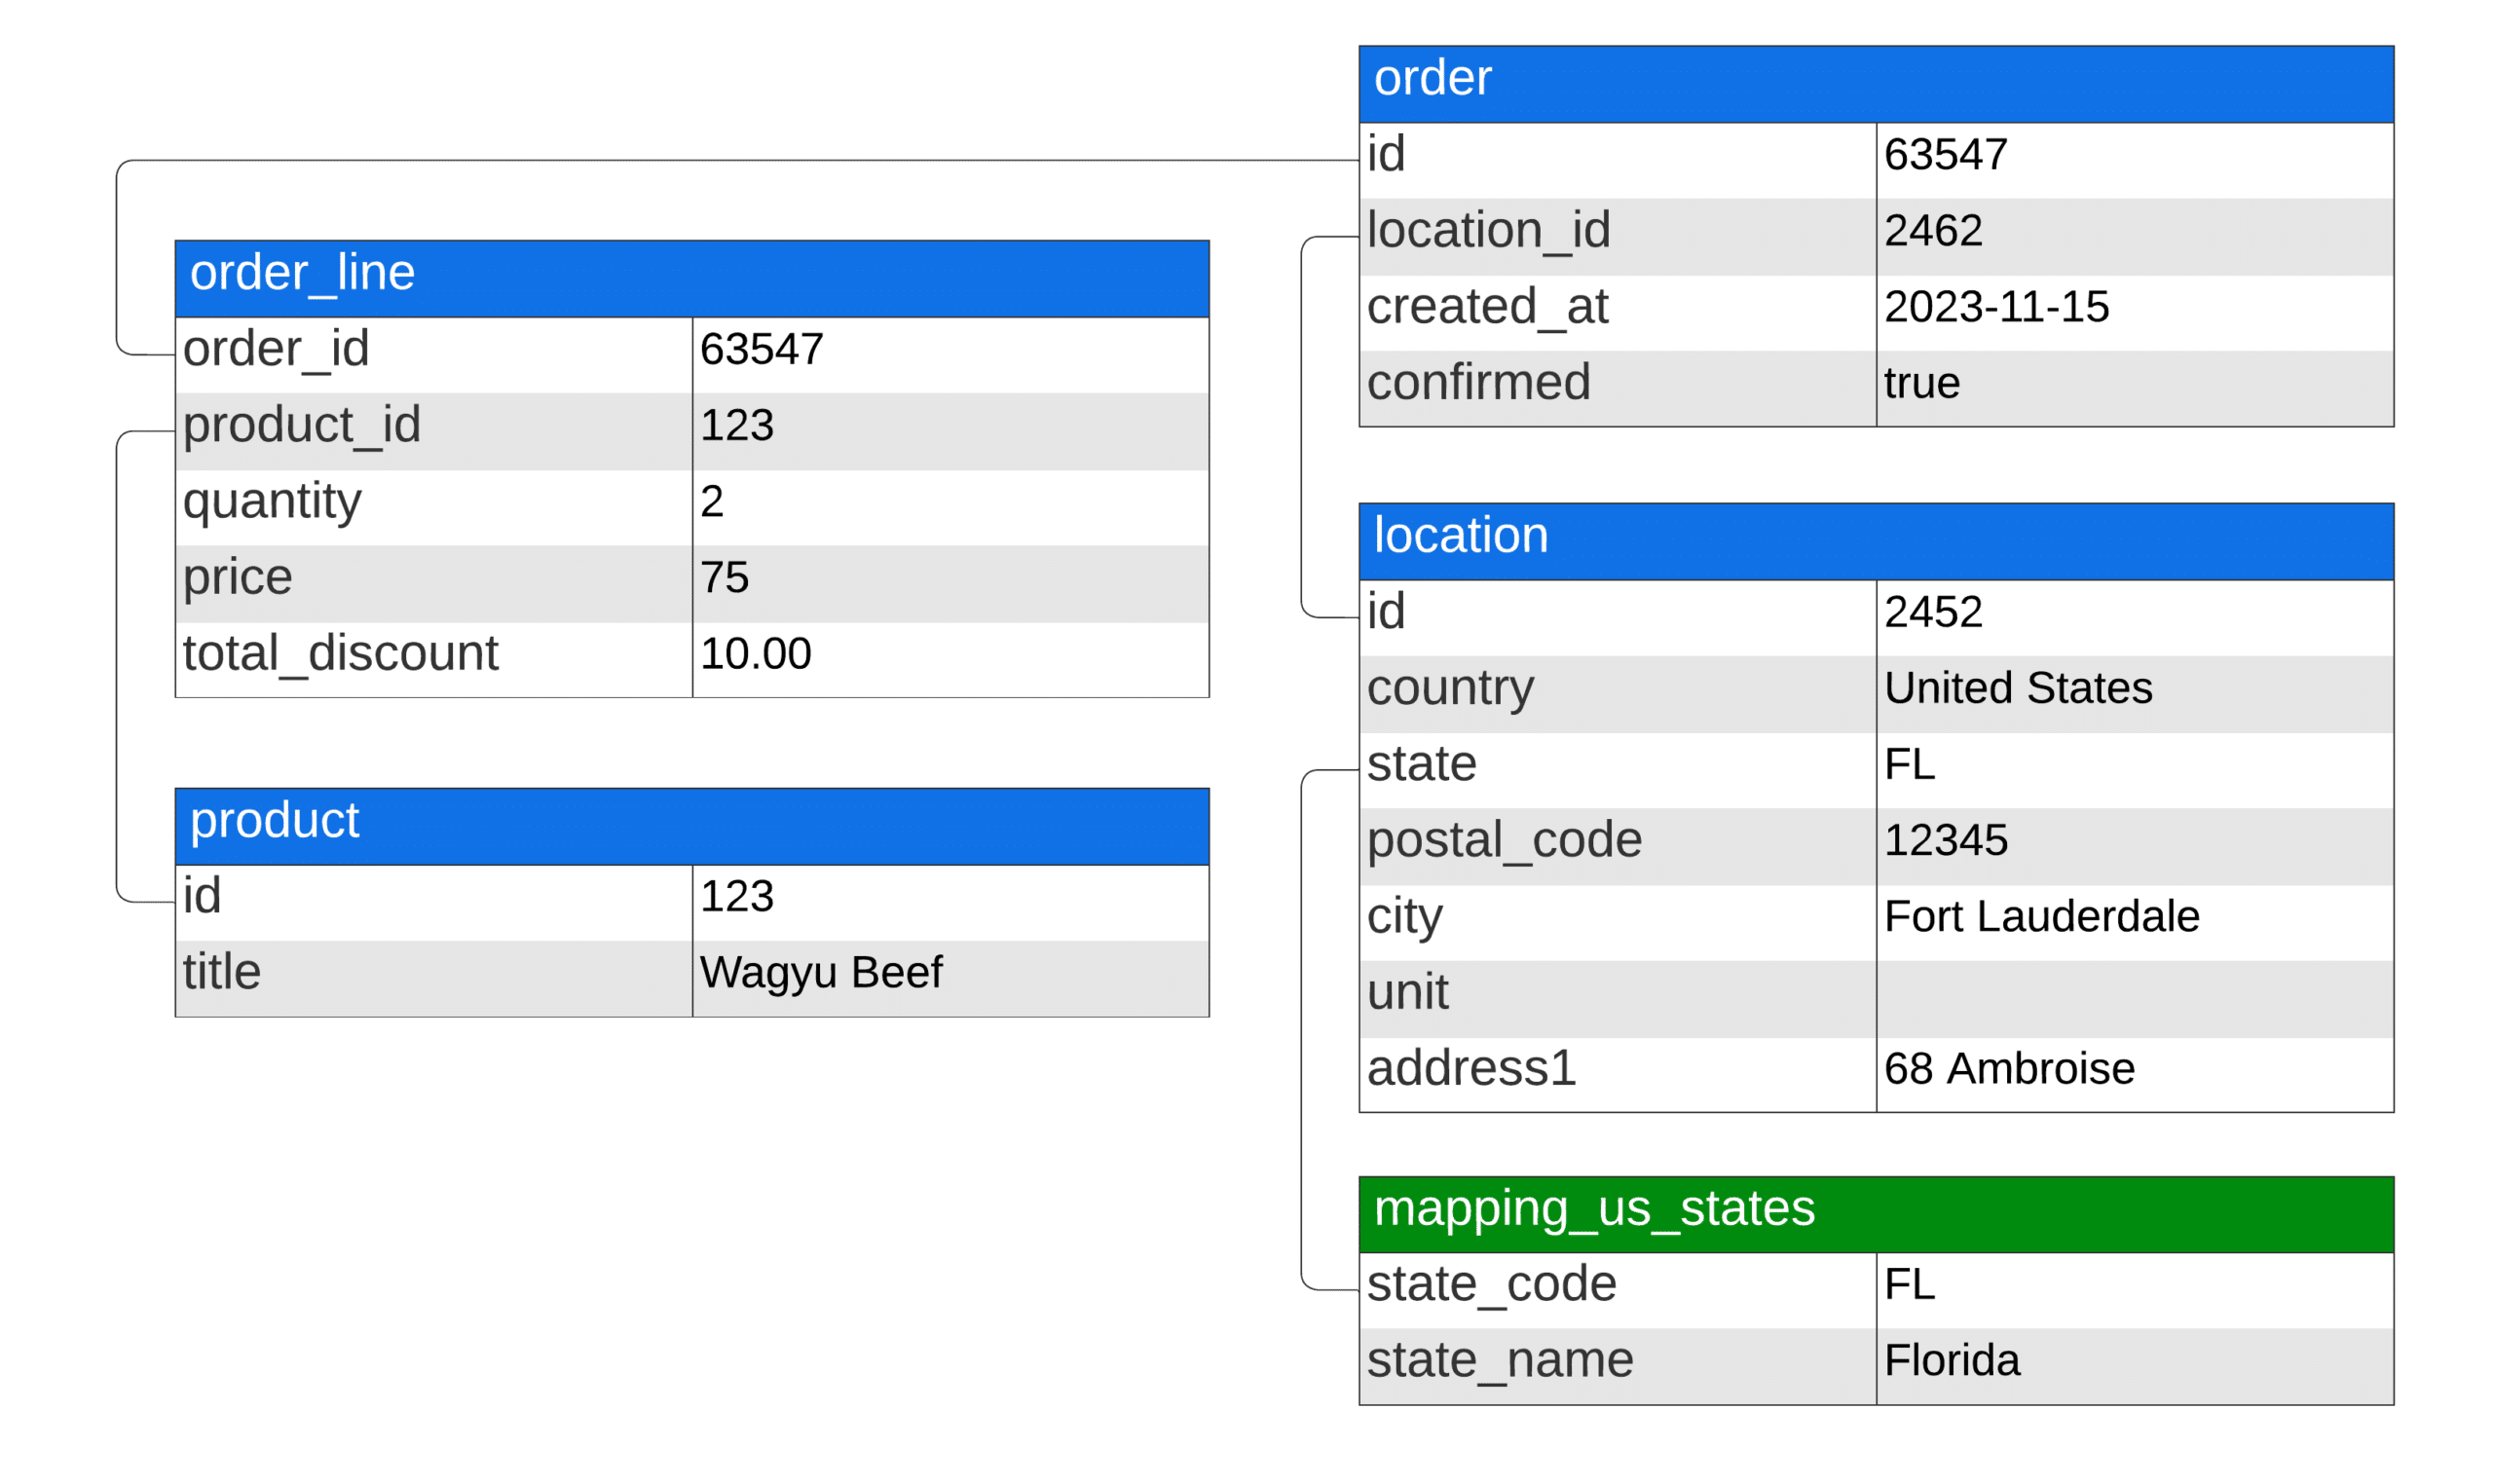
Here’s what Shopify data looks like:

Shopify data

Figure B, The tables shown are transposed for easier visualization.

As you can see, the data is fragmented into multiple entities. We call this diagram an Entity-Relationship Diagram (ERD). This is the standard for online transaction processing systems (OLTP). The goal of OLTP is to reduce redundancy and improve performance. However, our goal is to have optimized data for answering business questions.

So how do we go from Figure B to Figure A? Data needs to be transformed.

We won’t cover the best ways to transform data as this is well outside the scope of this article. The goal was simply to showcase how drastically different data from software is from the data we need for business intelligence.

Keep in mind that this is an overly simplified example. Once we start adding different data sources, complex business logic, and complex join, it becomes even more obvious why raw data shouldn’t be used for business intelligence.

Reason #2 – Data enrichment

Data enrichment is a critical reason for transforming data because it significantly enhances the value and utility of the original dataset, enabling deeper insights and more informed decision-making.

By augmenting existing data with additional context, details, or derived metrics, data enrichment helps businesses and organizations better understand their operations, customers, and markets.

Here are two examples of data enrichment:

Customer Segmentation in Retail: A retail company has basic customer data (e.g., age, gender, purchase history). The company can create detailed customer segments by enriching this data with additional information such as income levels, geographic location, and online browsing behavior (from cookies and web analytics). These segments allow for targeted marketing campaigns, personalized product recommendations, and improved customer service, ultimately enhancing customer satisfaction and loyalty.

Calculated fields: Creating new metrics or dimensions is also considered data enrichment. Your web analytics platform might only tell you how many users visited your website and how many purchases were made, but it is up to you to calculate the conversion rate.

By integrating additional information, refining existing data, and generating new insights, you’ll be able to unlock deeper, more actionable intelligence from your datasets.

Reason #3 – Improving data quality

Raw data often contains errors, missing values, duplicates, and inconsistencies that must be corrected. Transforming data helps clean it by fixing or removing these issues, thus improving its accuracy and reliability for analysis.

High-quality data is the foundation of a data-driven approach to business, and data transformation processes are essential for solidifying this foundation.

Reason #4 – Performance & cost efficiency

Transforming data to improve query performance and cost efficiency involves restructuring or processing data to make it more accessible and quicker to query while also managing the resources used more efficiently. This can include several specific transformation actions, such as:

Denormalization: Combining data from multiple tables into a single table reduces the complexity of queries and the need for joins, which can improve query performance at the cost of increased storage space.

Aggregating data: Pre-summarizing or aggregating data to a more coarse-grained level can significantly speed up queries that don’t require fine-grained detail, reducing the computational load.

Indexing: Creating indexes on columns frequently used in queries allows the database engine to find data more quickly.

Partitioning: Splitting large tables into smaller, more manageable pieces based on certain keys or ranges can make queries targeting specific data segments more efficient.

By incorporating these transformation strategies, the data becomes more aligned with the requirements of the querying and analytical processes, leading to faster query times and potentially lower costs, especially in pay-per-query or resource-intensive environments. This consideration is particularly relevant in cloud-based and big data platforms, where the volume of data and the complexity of queries can significantly impact costs and performance.

Reason #5 – Ensuring confidentiality & regulatory compliance

Data often contains sensitive information that, if exposed, could lead to privacy breaches, legal consequences, and loss of trust. Transforming data to protect confidentiality involves techniques such as anonymization, pseudonymization, and encryption, which help safeguard personal and sensitive information while still allowing for meaningful analysis.

Many industries are subject to regulations (like GDPR in the EU, HIPAA in the US for healthcare data, or CCPA in California) that mandate the protection of personal data. Transforming data to comply with these regulations is not just best practice; it’s a legal requirement.

Reason #6 – Tracking changes over time

You typically only get the latest value when getting data from operational systems. What if you need to track changes over time?

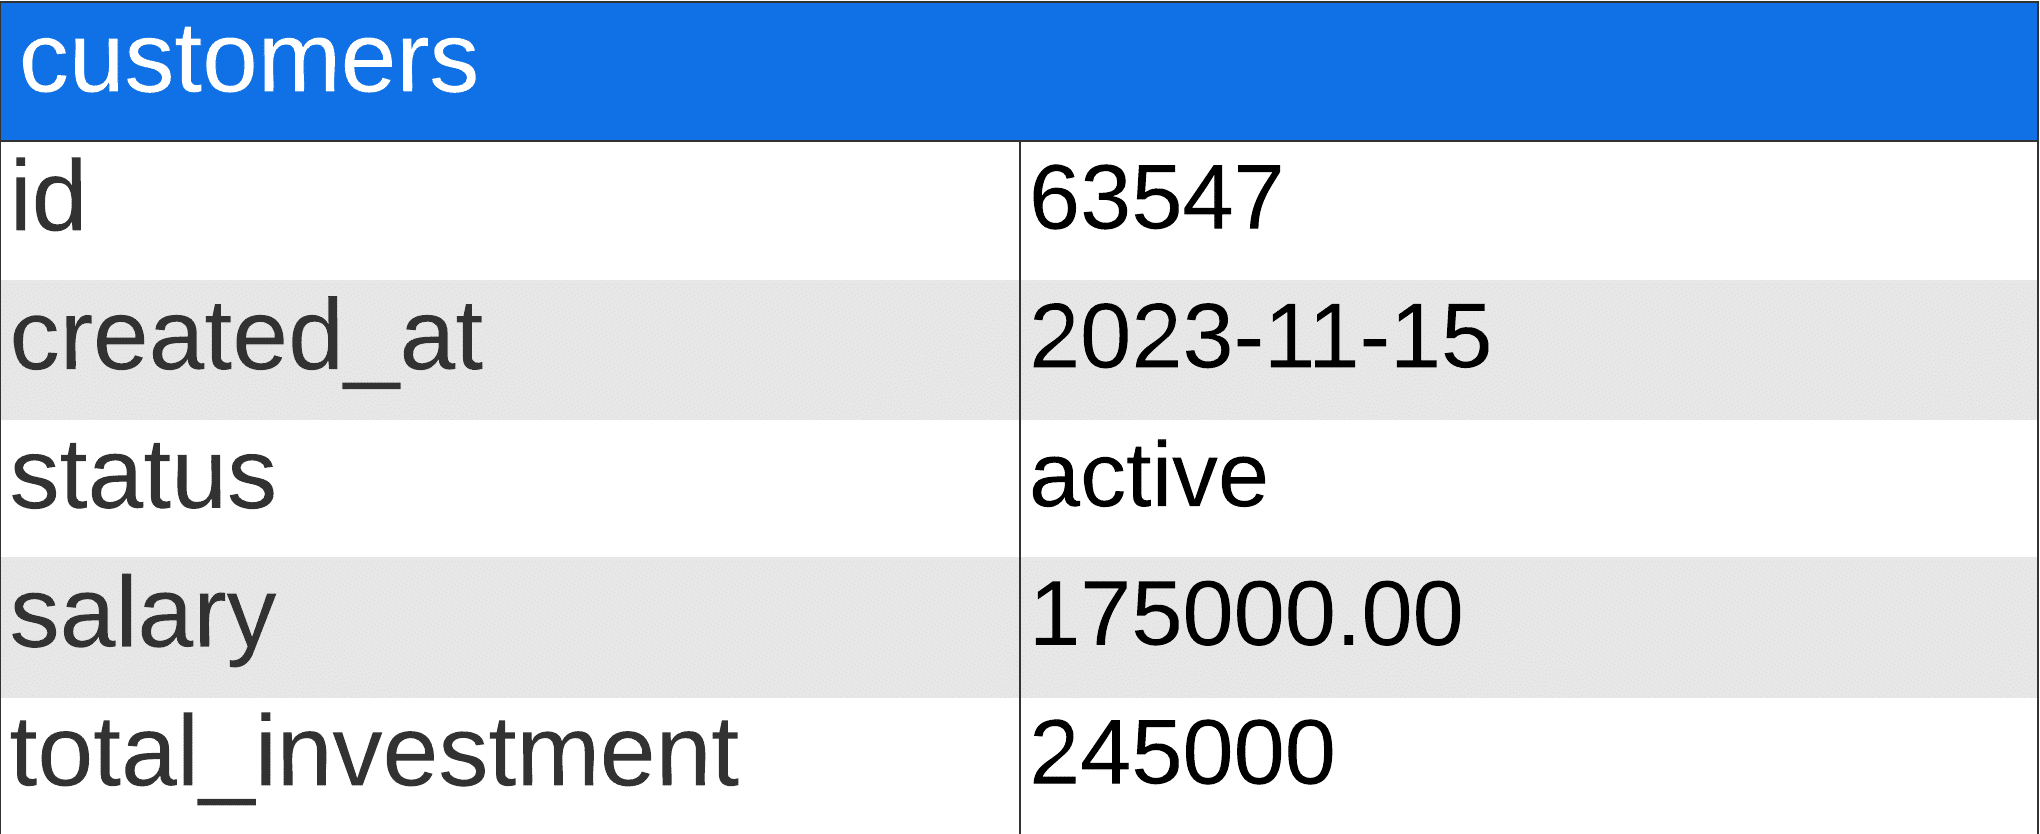
For example, let’s say you run an investment firm. The software you use to manage your customer investments has the following customer table:

Figure C, The table shown is transposed for easier visualization.

Salary, total_investment, and status are the most recent and only available records.

What if you’d like to know the average salary of your customers when they made their first investment, and what was the amount of that first investment? You couldn’t.

Another example would be an e-commerce company that wants to track gross margins over time. To do so, they use the following formula: ({SKU cost + Shipping cost} / {Revenue}) * 100.

If they only have access to the most recent value of SKU cost to calculate Gross Margin. Changing the SKU cost value would also change historical data, thus drastically compromising the data quality.

By storing snapshots when changes occur, you unlock new analytics capabilities.

Reason #7 – Optimizing for specific tools

Different tools often require data in specific formats, structures, or levels of granularity to function optimally. By transforming data to meet these requirements, organizations can ensure seamless integration, maximize the efficiency of data processing, and leverage the full capabilities of their analytical tools.

Here are some examples where that is true:

Data Visualization Tools: Tools like Tableau, Power BI, or Google Looker Studio require data to be in a structured format that supports the creation of visualizations. Transforming raw data into a clean, structured format with defined dimensions and measures enables these tools to effectively generate insightful and interactive dashboards.

Machine Learning Platforms: Machine learning algorithms often require data to be pre-processed and transformed into a format suitable for modeling, such as normalizing scales, encoding categorical variables, or handling missing values.

Time Series Analysis: Tools specialized in time series analysis, such as forecasting models, may require data to be in a time-stamped series format. Data might need to be transformed to ensure uniform time intervals, filled missing time points, or aggregated to the appropriate level of granularity.

Database Management Systems: When using databases like MySQL, PostgreSQL, or cloud-based solutions like Amazon Redshift or Google BigQuery, data may need to be transformed to optimize for the database schema, indexing strategies, or to leverage database-specific functions and optimizations for efficient querying and storage.

In each of these examples, the transformation of data to suit the specific requirements of tools and platforms is fundamental to unlocking the full potential of data analysis and processing capabilities.

Conclusion

Data transformation before analysis is not just a procedural step but a strategic necessity. Through these processes, data transformation will empower your organization to unlock the true potential of its data assets.


Navigating the complexities of data transformation can be daunting, but it’s a journey you don’t have to undertake alone. At Systematik, we specialize in turning the challenges highlighted in this article into opportunities for your business.

Book a free strategy session to discover how we can help you transform your business by transforming your data.

SHARE POST

Thank You!

Please check your email for the download links to our Ultimate Guide on How to Build a Data Strategy.

P.S. If you don’t see the email in your inbox within a few minutes, please check your spam or junk folder.