![]()
Tracking progress toward goals, whether it's revenue, leads, or any other key metric, is one of the most common reporting needs. Yet, Looker Studio doesn't provide an out-of-the-box way to compare performance against monthly or yearly targets, calculate pace, or show how much you need to average each day to stay on track.
In this guide, I'll walk you through how to build a flexible goal tracker in Looker Studio. The tracker adapts to different reporting periods (month to date or year to date), lets users set their own targets, and automatically calculates:
- Average performance per day
- Projected pace by the end of the period
- Remaining daily average required to hit the goal
By the end, you'll have a reusable setup that can scale to multiple metrics and goals without creating a mess of calculated fields. This approach makes it easy to bring accountability and foresight directly into your dashboards so you can stop guessing whether you're on track and start managing performance in real time.
Set up
You can follow along with your own dataset, or if you want to replicate exactly what is shown in this guide, you can use our demo resources:
Connect the dataset to your Looker Studio report or make a copy of the template, and you'll be ready to start building your own goal tracker.
Key point: Your data does not need a row for every calendar day. This setup uses calendar math functions (CURRENT_DATE, DATE_DIFF, DAY, etc.) to calculate elapsed days, total days in the period, and remaining days. If your store had no sales on a particular day and that date is missing from your dataset, the calculations for pace and required daily averages remain accurate.
Step 1: Create the date fields
Before we can calculate pace or required daily averages, we need to know three things:
- How many days are in the selected period
- How many days have elapsed so far
- How many days are left
We'll control the period with a parameter.
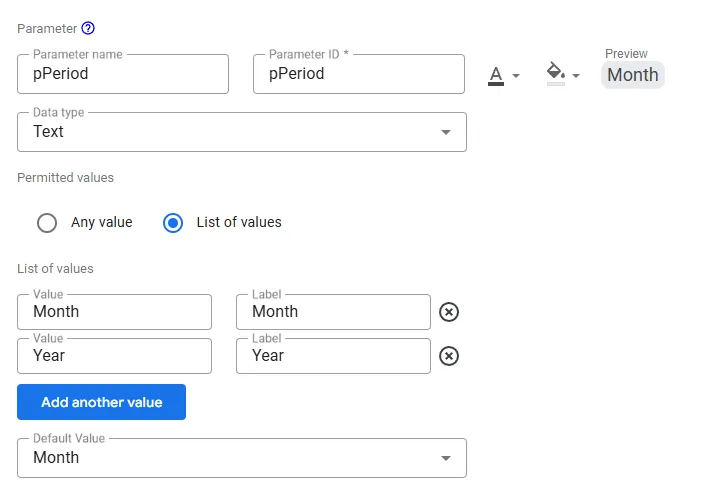
Create the pPeriod parameter
Create a new parameter with the following configuration:
Name: pPeriod
Type: Text
Permitted values: Month, Year
Default: Month
For this tutorial, we will only use monthly and yearly periods. However, you could extend the same logic to add quarterly, weekly, or any other period your reporting requires. Just add those values to pPeriod and update the formulas accordingly.
Here is how the parameter configuration looks in Looker Studio:
Days in period
This field calculates the total number of days in the chosen period (28ΓÇô31 for months, 365ΓÇô366 for years). It serves as the denominator for pacing projections. Create a calculated field with the following formula:
CASE
  WHEN pPeriod = "Month" THEN
    DATE_DIFF(
      DATE(YEAR(CURRENT_DATE()), MONTH(CURRENT_DATE()) + 1, 1),
      DATE(YEAR(CURRENT_DATE()), MONTH(CURRENT_DATE()), 1)
    )
  WHEN pPeriod = "Year" THEN
    DATE_DIFF(
      DATE(YEAR(CURRENT_DATE()) + 1, 1, 1),
      DATE(YEAR(CURRENT_DATE()), 1, 1)
    )
END
Then set the default aggregation to MAX.
Elapsed days
This field counts how many days have passed so far in the current period (inclusive of today). It is used to calculate daily averages:
CASE
  WHEN pPeriod = "Month" THEN DAY(CURRENT_DATE())
  WHEN pPeriod = "Year" THEN
    DATE_DIFF(CURRENT_DATE(), DATE(YEAR(CURRENT_DATE()), 1, 1)) + 1
END
Then set the default aggregation to MAX.
Remaining days
This field calculates how many days are left in the period, so we know how many opportunities remain to reach the target:
Days in period - Elapsed daysStep 2: Create the metric selector
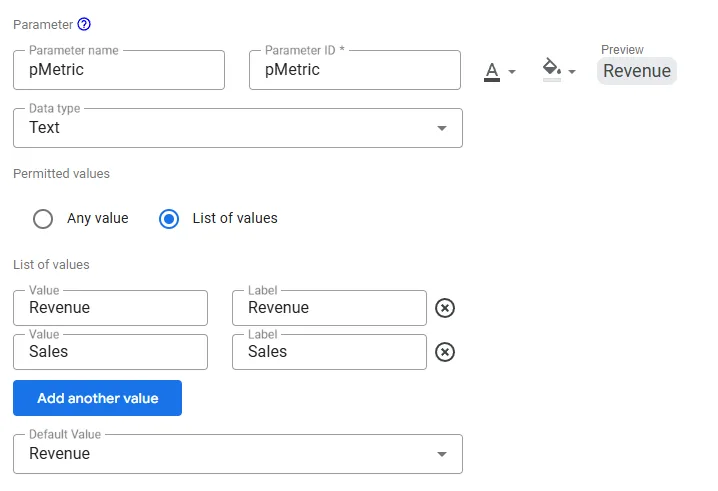
Since you may want to track more than one metric (for example, Revenue and Sales), it's helpful to create a parameter that lets the user select which metric they want to view.
Create the pMetric parameter
Create a new parameter with the following configuration:
Name: pMetric
Type: Text
Permitted values: Revenue, Sales (extend as needed)
Default: Revenue
Here is how the parameter configuration looks in Looker Studio:
Metric
This calculated field returns the correct metric value based on the user's selection, so you can track multiple KPIs without creating separate sets of calculated fields:
CASE
  WHEN pMetric = "Revenue" THEN SUM(Revenue)
  WHEN pMetric = "Sales" THEN SUM(Sales)
END
Step 3: Create the target field
Now that the metric selector is in place, define your goals in a single field that adapts to both the selected metric and the selected period.
Targets
This formula returns the full-period target based on the combination of metric and period:
CASE
  WHEN pMetric = "Revenue" AND pPeriod = "Month" THEN 500000
  WHEN pMetric = "Revenue" AND pPeriod = "Year" THEN 6000000
  WHEN pMetric = "Sales" AND pPeriod = "Month" THEN 1000
  WHEN pMetric = "Sales" AND pPeriod = "Year" THEN 12000
END
Replace these values with your own targets. Then set the default aggregation to MAX.
Target to date
This calculated field shows the prorated portion of the target that should have been achieved by now, based on elapsed days:
Targets * (Elapsed days / Days in period)Step 4: Build the tracker metrics
Now that you have the date fields, metric selector, and target field, you can calculate the three core metrics of the goal tracker.
Current daily average
This field calculates the average daily performance for the elapsed portion of the period. For example, if your revenue so far this month is $200,000 and 10 days have passed, this field returns $20,000:
Metric / Elapsed daysProjected
This field projects the total you would reach by the end of the current period if you continue performing at the same daily average achieved so far:
Current daily average * Days in periodRequired daily avg. to hit target
This field calculates how much you need to achieve per day for the remaining days in the period to still hit your target. For example, if you are $100,000 short of your monthly revenue target and 5 days are left, it will return $20,000:
(Targets - Metric) / Remaining daysStep 5: Build the pages
Each period (monthly, yearly) gets its own page with a locked date range and a fixed pPeriod value. This keeps the formulas simple and prevents viewers from accidentally breaking the tracker by overriding the date range.
Duplicate your page
Go to Pages, then Duplicate page. Rename one page Monthly and the other Yearly.
Lock each page's date range
Select all charts and scorecards on each page, then set the date range in the Data panel:
- Monthly page: Date range = Custom, then This month to date
- Yearly page: Date range = Custom, then This year to date
Remove any Date range control from both pages so viewers cannot override these defaults.
Set pPeriod per page
Go to Page, then Current page settings, then Parameters:
- Monthly page: set
pPeriod= "Month" - Yearly page: set
pPeriod= "Year"
Do not place a pPeriod control on these pages. A control would override the page setting and break the alignment between the date range and the formulas.
Add the metric selector
If you want users to switch metrics, add a parameter control for pMetric on both pages. If not, omit the control and rely on the default pMetric value.
Add navigation buttons
Add a way for viewers to switch between the Monthly and Yearly pages. Go to Insert, then Button, then set the Action to Go to page and link to the other page. Alternatively, insert a Text or Shape element, add a Link, and choose Report page.
Quick verification
Before sharing the report, confirm the following on each page:
- Monthly page results reflect month to date.
Elapsed daysshould equal today's day of the month. - Yearly page results reflect year to date.
Elapsed daysshould equal the day of the year. Pace,Target to date, andRequired daily averageadjust correctly when switching pages and when changingpMetric(if exposed).
Common mistake: Leaving a date range control on the page. This lets viewers override the MTD/YTD range and breaks the alignment between your locked date range and the pPeriod-driven formulas.
Common mistake: Forgetting to set pPeriod at the page level. Without this, the shared formulas (Days in period, Elapsed days, etc.) won't match the fixed date range, and the tracker will show incorrect values.
Step 6: Visualize the tracker
Add scorecards for the key metrics so viewers can see the full picture at a glance:
- Actual (MTD or YTD total)
- Target (full period and to date)
- Average per day
- Projected pace
- Required daily average
Consider adding a progress bar or bullet chart to visualize progress against the target. Conditional formatting on the scorecards (green when ahead of pace, red when behind) adds another layer of clarity without cluttering the layout.
Since this is an advanced tutorial, we won't go into detail on how to style the page or polish the layout. If you'd like help with styling, we cover that in our YouTube video, where you can see exactly how to format scorecards, charts, and navigation elements for a clean professional look.
Step 7: Extend and customize
Once the basic tracker is in place, you can take it further:
- Add more metrics by extending the
pMetricparameter and the Targets CASE formula - Add weekly or quarterly periods by extending the
pPeriodparameter and the date formulas - Apply conditional formatting or thresholds to highlight whether you are ahead or behind pace
Conclusion
Before this tracker, checking whether you were on pace meant opening a spreadsheet, pulling the latest numbers, and doing the math yourself. That workflow is slow, error-prone, and easy to skip when the day gets busy. Now that logic lives inside your dashboard. It updates automatically, adapts to different periods and metrics, and gives you the answer the moment you open the report.
The real value is not in any single formula. It is in the shift from reactive reporting ("here's what happened last month") to proactive management ("here's what needs to happen today"). When your team can see the required daily average every morning, the conversation changes from "are we behind?" to "what are we doing about it?"
If you'd like to customize this even further, for example by creating dynamic monthly goals based on last year's performance or designing more advanced goal logic, feel free to contact us. We can help you extend this framework to match your exact business needs.